The Peeking Problem in A/B Testing (And How to Fix It)
Checking your A/B test daily and stopping at the first win inflates your false positive rate. The math behind the peeking problem, and how to avoid it.
📚 This article is part of the guide A/B Testing Statistical Significance: Plain-English Guide.
The peeking problem is what happens when you check an A/B test’s results repeatedly and stop the moment it looks like a winner: each additional look is a new opportunity for random noise alone to cross your significance threshold, so a test built for a 5% false positive rate can quietly deliver a false positive several times more often than that. It is arguably the single most common way honest-looking A/B test results turn out to be wrong, and it is completely invisible in the reported p-value, because that p-value was calculated as if you’d only looked once.
This guide is a deep dive on one specific mistake covered briefly in our guide to A/B testing statistical significance: what peeking actually does to your error rate, the math behind why, a worked illustration, and the handful of stopping rules that hold up under scrutiny.
What the peeking problem actually means
Peeking is checking your test’s dashboard before it has reached its planned sample size or duration, and letting what you see influence your decision to keep going or stop. On its own, looking is harmless. The damage comes from combining looking with an implicit stopping rule most people never state out loud: “I’ll keep the test running until the result looks significant, then stop.”
That rule feels reasonable. It is exactly what breaks the guarantee behind your p-value. A p-value threshold of 0.05 promises a 5% false positive rate under one specific condition: that you decided on a sample size in advance and looked at the result exactly once, at the end. The moment you look more than once and let an early “significant” result end the test, you are no longer running the test that produces that 5% guarantee, you are running a different procedure with a much higher error rate that happens to print the same-looking number.
Why repeated looks inflate the false positive rate
Think of a genuinely dead-even test, where A and B have identical true conversion rates. Because of random noise in who converts and who doesn’t, the observed difference between A and B wanders around zero as more visitors arrive, sometimes drifting toward “B is winning,” sometimes toward “A is winning.” At any single, pre-committed sample size, there’s a fixed 5% chance that random wandering happens to have crossed the significance line at that exact moment. That’s the promise a p-value makes.
But if you check after every 100 visitors and stop the instant the line is crossed, you’re no longer asking “did it cross the line at this one moment?” You’re asking “did it cross the line at any of these many moments?” And a wandering line that’s checked dozens of times has many more chances to briefly touch a threshold than one checked once, even though the underlying process (two genuinely identical variants) never changed.
How much does it actually inflate the error rate?
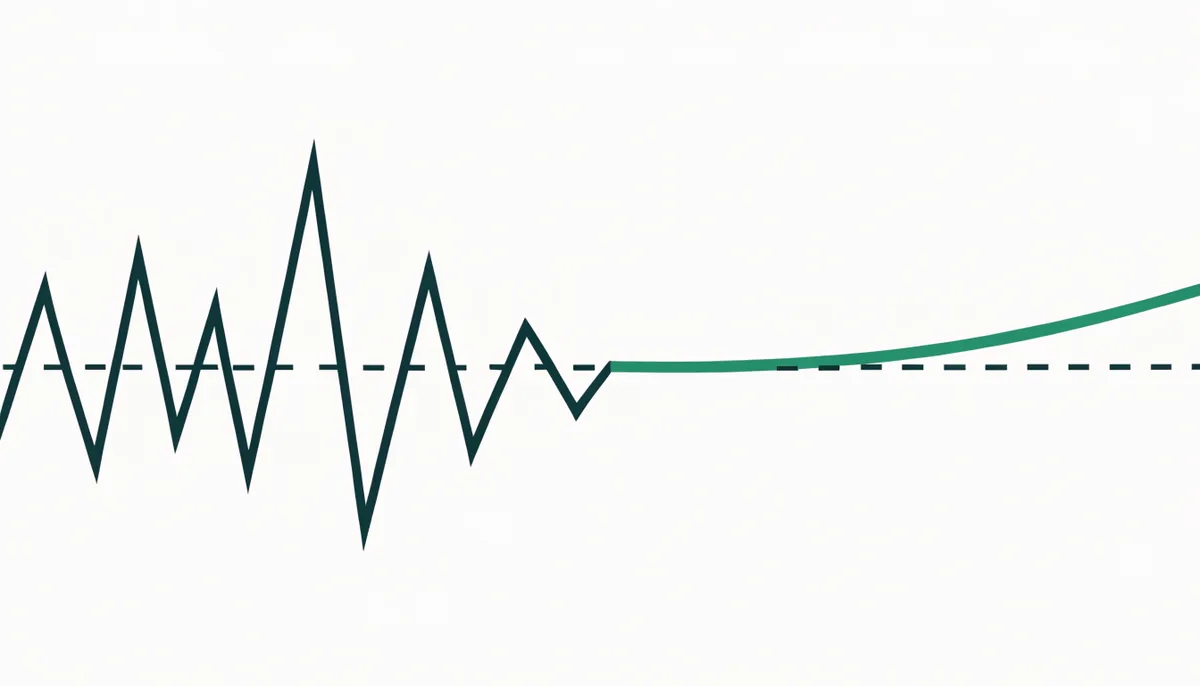
This isn’t a vague warning, it’s been quantified. In his widely cited 2010 analysis, statistician Evan Miller showed that continuously monitoring a test and stopping the instant it crosses a nominal 5% threshold can push the real false positive rate to roughly 26%, more than five times the number printed on the dashboard (Miller, 2010). The relationship between number of looks and inflated error rate looks roughly like this:
The intuitive version Miller uses is worth remembering on its own: if you peek at an ongoing test ten times and stop at the first significant read, what you think is a 1% significance level is really closer to a 5% one. The nominal number on your screen and the number that actually describes your risk of a false win can be five times apart.
A worked illustration: what one “lucky” peek looks like
Say you’re running a checkout redesign test with a true, unchanging 4% conversion rate on both sides, meaning any observed difference is pure noise. You commit to checking the dashboard every day instead of waiting for your planned two-week window. By day 6, you’ve collected 900 visitors per variant: 29 conversions for A (3.2%) and 46 for B (5.1%). Paste those numbers into the calculator below.
Two-sided two-proportion z-test. "Not significant" almost always means not enough sample, not that the versions are equal.
On a dataset like this, the daily-peeking observer sees a p-value hovering near or under 0.05 and stops, satisfied. But because A and B were built identical in this scenario, that “win” is not real, it’s exactly the kind of random wobble the inflation curve above predicts will show up at a meaningfully higher rate than 5% of the time when you’re checking every day and stopping on the first favorable read. Two weeks later, with the full planned sample, that gap would very likely have closed back toward zero, but the peeking observer never got there, they’d already shipped a change that does nothing.
Why this isn’t unique to frequentist statistics
It’s tempting to conclude the fix is simply “switch to Bayesian statistics,” since Bayesian tools let you look at a posterior probability at any time without it being mathematically invalid. That part is true and is a real advantage. What doesn’t follow is that Bayesian testing is immune to peeking’s practical effect. A Bayesian posterior computed at N=100 is always a correctly calibrated summary of the evidence so far, that’s genuine. But a decision rule of “keep checking P(B beats A) and stop the first moment it crosses 95%” is still an optional stopping procedure, and optional stopping inflates your real error rate regardless of which framework computed the number you stopped on. Our guide to Bayesian A/B testing covers exactly this nuance, including the stopping rules that do hold up in a Bayesian workflow.
Stopping rules that actually hold up
| Approach | How it works | Trade-off |
|---|---|---|
| Fixed horizon | Calculate sample size and duration up front from your baseline rate, MDE, significance, and power; only decide at that endpoint | Simplest, zero extra math, requires patience and no early peeking on the decision |
| Sequential testing / always-valid inference | Purpose-built statistical methods that “spend” your error budget across multiple looks, so you can check often and stop early without inflating the false positive rate | Requires tooling built for it; not the same as checking a plain p-value repeatedly |
| Bayesian threshold + minimum N | Pre-commit to a P(B beats A) threshold (e.g. 95%) combined with a minimum sample size, rather than a threshold alone | Reduces but does not eliminate optional-stopping risk if the minimum N is set too low |
| Group sequential design | Plan a small, fixed number of interim looks in advance, each with a stricter significance bar (alpha-spending), so the total error budget stays at 5% | Common in clinical trials; needs the schedule fixed before the test starts, not improvised |
Of these, the fixed horizon is the one every team can adopt today with no new software: decide your sample size and duration before launch, using the same sample-size calculator that powers our statistical significance guide, and treat the interim dashboard as informational only, never as a decision trigger.
How peeking sneaks in even on disciplined teams
Almost nobody sets out to peek dishonestly. It usually arrives disguised as reasonable behavior. A stakeholder asks “how’s the new checkout test doing?” three days in, and someone pulls up the dashboard to answer, which is harmless on its own, until the number happens to look good and the conversation shifts to “should we just ship it now?” A dashboard that auto-refreshes and displays a live p-value is itself an invitation: the tool doesn’t distinguish between “I’m curious” and “I’m deciding,” but the human looking at it often blurs the two under time pressure.
Two organizational patterns make this worse. The first is rewarding speed over rigor, a team under pressure to show weekly wins has every incentive to call a test early the moment the number crosses the line, because a “significant” result today reads better in a status update than “still running” does. The second is not writing the stopping rule down anywhere before the test launches. If nobody can point to a document that says “we decided in advance to run this for two weeks and 8,400 visitors,” there’s no guardrail stopping the team from quietly renegotiating the finish line the moment the data looks favorable, and no way to tell, after the fact, whether that happened.
The fix isn’t more willpower, it’s making the pre-committed endpoint visible and hard to renegotiate: write the planned sample size and end date into the experiment brief before launch, and treat any early “it’s significant!” as a note for later, not a decision.
What you can safely do before the test ends
Not looking at all until the end isn’t realistic, and it isn’t necessary. What matters is separating monitoring from deciding:
- Watch guardrail metrics freely. If checkout errors spike or page load time collapses, that’s an engineering or ops problem, stop the test for that reason, not because the conversion metric looks good or bad.
- Watch for Sample Ratio Mismatch. If your intended 50/50 split is landing at 60/40 with no explanation, something is broken in randomization and no result from that test will be trustworthy regardless of timing.
- Never let the primary metric’s apparent significance change your stop date. This is the one rule that, broken, recreates the entire problem this guide is about.
- If you truly need to look often and act on it, use a sequential method built for that, not a plain p-value checked repeatedly.
Do this automatically on Donnu
Peeking is a discipline problem disguised as a statistics problem: the fix costs nothing but patience, and yet it’s the mistake that quietly invalidates more A/B tests than almost anything else. Donnu calculates your sample size and duration up front and keeps the decision locked to that endpoint, so the dashboard stays honest even if you check it every hour out of curiosity.
Start a free 14-day trial and run your next test on numbers you can trust. For the full statistical picture, see our guide to A/B testing statistical significance, and for the Bayesian side of this same question, see our guide to Bayesian A/B testing.
References
- Miller, E. How Not To Run an A/B Test. 2010. evanmiller.org.
- Johari, R., Pekelis, L. & Walsh, D.J. Always Valid Inference: Bringing Sequential Analysis to A/B Testing. arXiv:1512.04922. arxiv.org.
- Kohavi, R., Tang, D. & Xu, Y. Trustworthy Online Controlled Experiments: A Practical Guide to A/B Testing. Cambridge University Press, 2020. Companion site at experimentguide.com.
- Georgiev, G. Statistical Methods in Online A/B Testing. analytics-toolkit.com.
Frequently asked questions
- What is the peeking problem in A/B testing?
- It is the practice of checking an ongoing A/B test repeatedly and stopping as soon as the result looks statistically significant. Each additional look is a new chance for random noise alone to cross the significance threshold, so a test designed to have a 5% false positive rate can end up with a real false positive rate several times higher.
- How much does peeking actually inflate the false positive rate?
- It depends on how often you look. Continuously monitoring a test and stopping at the first apparent win can push a nominal 5% significance level to roughly 26% real false positives, per Evan Miller's widely cited 2010 analysis. Even a handful of scheduled peeks, five or so, can push the true rate into the 12 to 15% range, a result documented in the classical repeated-significance-testing literature (Armitage, McPherson & Rowe, 1969).
- Is Bayesian A/B testing immune to the peeking problem?
- No, not fully. A Bayesian posterior is a valid summary of the evidence at any sample size, which is a genuine advantage. But if your stopping rule is "keep checking P(B beats A) and stop the first time it looks good," that optional-stopping behavior still inflates your practical error rate, in either framework. Our guide to Bayesian A/B testing covers this nuance in full.
- Can I ever look at my test results before it finishes?
- Yes, looking is not the problem, stopping based on what you see before your planned sample size or duration is. You can monitor a test for guardrail metrics (a checkout that is breaking, for example) without touching your decision rule, as long as you commit to only declaring a winner or loser at the pre-registered endpoint, or you use a sequential testing method built to allow early stopping validly.
- What is the simplest fix for the peeking problem?
- Decide your sample size and test duration before you start, based on your baseline conversion rate and the minimum effect you care about detecting, and only make the ship or kill decision once you hit that number. It costs nothing and eliminates the problem entirely, at the price of a small amount of patience.