One-Tailed vs Two-Tailed Test in A/B Testing
One-tailed vs two-tailed test in A/B testing: the critical z, the sample it saves, the risk of picking the tail after the data, and when it is legitimate.
📚 This article is part of the guide A/B Testing Statistical Significance: Plain-English Guide.
A one-tailed test is a hypothesis test that looks for a difference in a single direction, chosen before any data comes in, so it puts all of its false positive risk in one tail; a two-tailed test looks for a difference in either direction and splits that risk in half. At 95 percent confidence, a one-tailed test calls a winner from z equals 1.645, and a two-tailed test only from 1.96. In practice, the one-tailed version needs about 21 percent fewer visitors and, when the effect goes the predicted way, returns a p-value that is exactly half the two-tailed one. The price is going blind to a variation that makes things worse and, if the tail is picked after looking at the data, doubling the very error you think you are controlling. This article is part of our guide to A/B testing statistical significance, which recommends two-tailed as the default in a single paragraph; here is the full math behind that recommendation, with a simulation, sources on both sides, tool defaults and a worked ecommerce and SaaS example, plus the exceptions where it does not hold.
One-tailed vs two-tailed test: the definitions
Every frequentist A/B test has a null hypothesis, the one you are trying to knock down, and an alternative, the one you want to show. The whole difference between one-tailed and two-tailed lives in how the alternative is written.
- Two-tailed (two-sided) test: the alternative is “B’s rate is different from A’s”. A result far above or far below what the null predicts counts as evidence, and alpha (the false positive risk) is split across both tails.
- One-tailed (one-sided) test: the alternative is “B’s rate is higher than A’s” (or lower, if the direction you care about is a drop). Only the chosen direction counts, and all of alpha sits there.
The sample size calculator on this blog says “two-sided” and “one-sided”; many textbooks say “two-tailed” and “one-tailed”. Same thing.
| two-tailed | one-tailed (direction: B better) | |
|---|---|---|
| null hypothesis | B equals A | B is less than or equal to A |
| alternative hypothesis | B differs from A | B is greater than A |
| where the 5% alpha goes | 2.5% in each tail | 5% in the upper tail |
| critical z at 95% | 1.96 in absolute value | 1.645 |
| can it conclude B got worse? | yes | no |
| question it answers | is B different from A? | is B better than A? |
Nothing changes in the z-score formula, which is still the difference between the rates divided by the standard error. Only the yardstick that z is compared against changes.
What changes in the rejection region: 1.645 vs 1.96
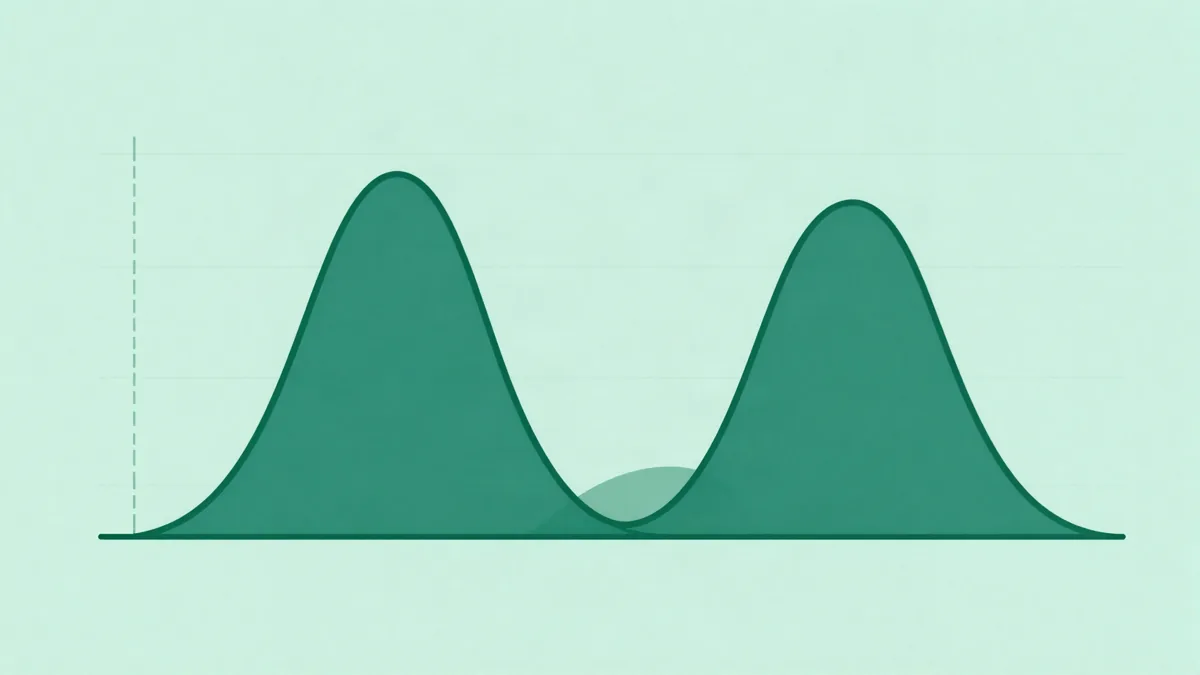
The rejection region is the set of z values that lead you to reject the null. For a two-tailed test at 95 percent, it is anything above 1.96 or below minus 1.96: each strip holds 2.5 percent of the probability under the null. For a one-tailed test at 95 percent, it is anything above 1.645, a single strip holding 5 percent.
The strip between 1.645 and 1.96 is the disagreement zone: significant for whoever recorded a one-tailed test, not significant for whoever recorded a two-tailed one. Under the null it holds 2.5 percent of the probability, the slice that comes back when we get to the cost of picking the tail after the fact. Critical values, computed with zCritical(alpha, sided) from the blog statistics engine:
| confidence | alpha | one-tailed critical z | two-tailed critical z |
|---|---|---|---|
| 90% | 0.10 | 1.2816 | 1.6449 |
| 95% | 0.05 | 1.6449 | 1.9600 |
| 99% | 0.01 | 2.3263 | 2.5758 |
Look at the diagonal: one-tailed at 95 percent uses the same number as two-tailed at 90 percent. Hold on to that, because it explains where the sample saving comes from.
The one-tailed p-value is half the two-tailed one, if the effect goes the predicted way
The two-tailed p-value adds up the area in both tails beyond the observed z, in absolute value. The one-tailed p-value only counts the chosen tail. Because the normal curve is symmetric, the relationship is exact:
GraphPad states both halves in its FAQ: in the predicted direction, the one-tailed p-value is half the two-tailed one; in the opposite direction, even a large difference would have to be attributed to chance and called not statistically significant.
That relationship is what lets you read a pre-recorded one-tailed test with the significance calculator in this guide, which is always two-sided: if the variation is ahead, in the recorded direction, halve the p-value on screen. If it is behind, the one-tailed p-value is 1 minus half, and for that test a regression does not exist as a conclusion.
How much sample a one-tailed test saves
The two-proportion sample size formula squares the sum of the critical z and the power z. Swapping 1.96 for 1.645 shrinks that sum: at 80 percent power (z of 0.8416), the ratio comes out near (1.645 + 0.8416)² ÷ (1.96 + 0.8416)², about 0.79. Computed with sampleSizePerVariant, at 95 percent confidence and 80 percent power:
| typical context | baseline | minimum effect (relative) | two-tailed, per variation | one-tailed, per variation | saving |
|---|---|---|---|---|---|
| ecommerce, visitor to purchase | 2% | 10% | 80,682 | 63,553 | 21.2% |
| ecommerce, visitor to purchase | 2% | 20% | 21,109 | 16,627 | 21.2% |
| ecommerce, product page | 3% | 10% | 53,211 | 41,914 | 21.2% |
| ecommerce, product page | 3% | 20% | 13,914 | 10,960 | 21.2% |
| SaaS, visitor to trial | 5% | 10% | 31,234 | 24,603 | 21.2% |
| SaaS, visitor to trial | 5% | 20% | 8,158 | 6,426 | 21.2% |
| SaaS, trial to paid | 10% | 10% | 14,751 | 11,620 | 21.2% |
| SaaS, trial to paid | 10% | 5% | 57,763 | 45,500 | 21.2% |
Three readings. The saving is nearly constant: about 21 percent at 80 percent power, at any baseline and effect; at 90 percent power, about 18.5 percent (71,233 versus 58,057 in the 3 percent and 10 percent row). It is not a discount: every number in the one-tailed column is identical to the two-tailed sample at 90 percent confidence, the same coincidence our guide on how many visitors an A/B test needs points out with 13,914 and 10,960. It is the same error budget spent on one tail. It is a small lever: moving the minimum effect from 10 to 20 percent cuts about 74 percent of the sample (from 53,211 to 13,914), because sample shrinks with the square of the effect, as the minimum detectable effect guide explains; switching tails cuts 21.
Georgiev, who argues for one-tailed tests on the Analytics-Toolkit blog, writes that a two-sided test at 95 percent needs 20 to 60 percent more sample than a one-sided one to detect the same effect. That squares with the table: 53,211 is 27 percent more than 41,914, and he says the range varies with the required significance threshold.
The saving that vanishes on the calendar
There is an operational detail that changes the math: A/B tests should run whole weeks to cover the weekday and weekend behavior cycle, as our guide on weekly cycles in A/B tests explains. Rounded up to full weeks, the saving can become a full week, or nothing.
| scenario | weekly traffic | two-tailed | one-tailed | whole weeks, two-tailed | whole weeks, one-tailed |
|---|---|---|---|---|---|
| ecommerce, 3% baseline, 10% effect | 42,000 | 53,211 per variation, 18 days | 41,914 per variation, 14 days | 3 | 2 |
| SaaS, 8% baseline, 15% effect | 6,000 | 8,568 per variation, 20 days | 6,749 per variation, 16 days | 3 | 3 |
The flip side of the same coin is power. Keep the two-tailed sample and analyze one-tailed, and power goes up: at a 3 percent baseline with a 10 percent effect, 53,211 visitors per variation give 80 percent power two-tailed and 87.63 percent one-tailed, per the engine’s powerForSample. The statistical power calculator runs that for your numbers.
Cost 1: going blind to the variation that makes things worse
The one-tailed saving is paid for with one fewer conclusion. A test recorded as “B is better than A” only has two outcomes: evidence that B is better, or no such evidence. A variation that tanks conversion lands in the second bucket, right next to a neutral one.
In numbers: the store from the worked example runs a different variation for two weeks, 42,000 visitors per arm. Control converts 1,260 (3.00 percent); the variation, 1,150 (2.74 percent), an 8.7 percent relative drop.
- Two-tailed reading: z of minus 2.2736, p-value of 0.0230, 95 percent interval for the difference from minus 0.4877 to minus 0.0361 percentage points. Significant: A wins. The team knows the idea hurt conversion and logs the learning.
- One-tailed reading, direction B better: p-value of 0.9885. Not significant. The report says exactly what it would say about a tie.
In the significance calculator further down, those numbers show as 3.00% and 2.74%, relative lift of -8.7%, p-value 0.0230, interval -0.5% … -0.0% (pp) and Significant winner · A wins.
How much this matters depends on what a regression would change in your decision. If “B got worse” and “B tied” both lead to the same place, not shipping, the blindness costs little for that decision. It still costs you in learning (the idea that hurt comes back to the backlog in six months) and when validating changes that already shipped without a test. With the sample planned for one-tailed (41,914 per variation), a two-tailed test would have 74.22 percent power to catch a 10 percent relative drop; the one-tailed test does not have that conclusion in its design.
Cost 2: picking the tail after seeing the data
A one-tailed test holds error at 5 percent if the direction was chosen beforehand. If the team looks at the result and only then decides which way to test, the direction becomes a reflection of the data itself.
The math is short. Under the null, z lands above 1.645 in 5 percent of tests and below minus 1.645 in another 5. Testing one-tailed “in whichever direction the variation went” rejects in both cases: 10 percent. Running two-tailed and, when that fails, switching to one-tailed only if the variation is ahead rejects above 1.645 (5 percent) or below minus 1.96 (2.5 percent): 7.5 percent.
So as not to lean on algebra alone, we ran a fixed-seed simulation: 20,000 A/A tests, 5,000 visitors per arm, a true conversion rate of 5 percent on both (no real difference), the mulberry32 pseudorandom generator with seed 20260915, each test analyzed with the same significance function the calculators use.
| analysis rule | “significant difference” rate | variation false win | control false win | theory |
|---|---|---|---|---|
| two-tailed, recorded upfront | 5.00% (999) | 2.57% (513) | 2.43% (486) | 5% |
| one-tailed, recorded upfront, B better | 5.12% (1,023) | 5.12% (1,023) | not possible | 5% |
| one-tailed in whatever direction the data went | 9.89% (1,978) | 5.12% (1,023) | 4.78% (955) | 10% |
| rescue: two-tailed, then one-tailed if it fails with B ahead | 7.54% (1,509) | 5.12% (1,023) | 2.43% (486) | 7.5% |
This is where serious sources disagree, and both sides are worth reading.
The case for one-tailed. Georgi Georgiev, of Analytics-Toolkit and the onesided.org site, argues that one-sided p-values and confidence bounds carry the same error probabilities as two-sided ones, each under its own null, and goes as far as saying a directional claim can be backed by the matching one-sided test with no prior prediction at all. The simulation agrees with the technical part: “B is better than A” claimed with a one-tailed test at 5 percent is wrong under the null about 5 percent of the time (5.12 in the table), predicted or not.
The case for recording the direction first. The simulation also shows that a team allowing itself both claims, “B is better” or “A is better”, depending on the data, makes some false claim in almost 10 percent of A/A tests. UCLA is blunt: choosing a one-tailed test just to reach significance, or after a two-tailed test failed to reject the null, is not appropriate, no matter how close the two-tailed test came. GraphPad recommends using only two-tailed p-values, partly to avoid the temptation of changing the analysis after seeing the result.
The positions reconcile once you ask which error matters for your decision:
- Current control versus a new variation. Only a B win turns into a launch, so the column that matters is “variation false win”: 2.57 percent for a recorded two-tailed test and 5.12 for the rescue. The rescue is no worse than an honest one-tailed test; the problem is the team believing it ran a 95 percent two-tailed test, with half that risk, and reporting it that way.
- Two new versions with no incumbent (two headlines, two offers, either can ship). Both wins become launches, and “one-tailed in the data direction” ships a version by pure chance in 9.89 percent of cases.
- A learnings library. If “the change hurt conversion” becomes team knowledge, the control false win costs something too, and the total rate is what counts.
The defect is not the tail. It is the announced confidence not matching the procedure used, the same mechanism behind the peeking problem and the forking paths of a pre-registered analysis plan.
When a one-tailed test is legitimate
A one-tailed test is legitimate when three conditions hold together.
- The direction is written down before the test. In the analysis plan or the tool configuration, not in the results deck.
- A result in the opposite direction would lead to the same decision as a tie. UCLA frames the criterion by consequences: a one-tailed test fits when the cost of missing an effect in the untested direction is negligible and in no way irresponsible or unethical. In conversion testing that is almost true (do not ship), but not entirely (the learning is lost).
- The reported confidence matches the procedure. The report says “one-tailed at 95 percent”, not “95 percent confidence”, which any reader will take as two-tailed.
There are contexts where one-tailed is not a shortcut but the right question:
- Guardrails. On a protective metric, only a regression matters. Statsig documentation lists detecting regressions in guardrail metrics as a typical use, with the example of a feature where you may not care whether crash rates go down but you do care whether they go up. See guardrail metrics.
- Non-inferiority. Showing that a cheaper or compliance-driven change does not hurt conversion beyond a margin is one-sided by nature. ICH E9 calls for a one-sided interval in those trials, and our equivalence testing guide works through the case with a declared margin.
- Superiority with a margin. If shipping only pays off above a minimum gain, the null can be “B does not beat A by at least X”, which puts direction and implementation cost in the same hypothesis.
ICH E9 also holds the most conservative position. It acknowledges the topic is controversial, asks for prospective justification of one-sided tests, and says that in regulatory settings it is preferable to set the one-sided type I error at half the two-sided one, 2.5 percent. By that yardstick a one-tailed test saves no sample: the critical z is 1.96 either way. A conversion test does not need drug-trial rigor, but the reasoning travels: if the sample saving is the only reason, you are loosening the bar, not sharpening the question.
What serious sources and tools say
The table summarizes the position of each source read for this guide. Tool documentation changes; the tool rows were checked on September 15, 2026.
| source | position | what it supports |
|---|---|---|
| Georgiev, Analytics-Toolkit (2017, updated 2018) and onesided.org | for one-tailed in most A/B tests | one-tailed when action depends on a difference in one direction; no more type I error than two-tailed; two-tailed needs 20 to 60% more sample |
| GraphPad, FAQ 1318 | recommends two-tailed p-values only | one-tailed p is half the two-tailed p in the predicted direction; direction must be predicted before the data |
| UCLA, Statistical Consulting | one-tailed only with a consequences-based justification | picking one-tailed to reach significance or after a failed two-tailed test is not appropriate |
| ICH E9 (clinical trial guideline) | one-sided needs prospective justification; half the two-sided alpha in regulatory settings | one-sided interval for non-inferiority |
| Optimizely, Statistical significance | uses two-tailed | two-tailed is required by Stats Engine false discovery rate control |
| Statsig, One-Sided Test | two-sided by default; one-sided configurable per metric | one-sided tests do not detect movement in the unspecified direction; guardrail use cases |
| Convert, Next Generation of Convert Experiences | offers one-tailed and two-tailed in frequentist mode | left-tailed or right-tailed choice for one-tailed tests |
On the tools, only what the pages read actually say. Statsig lets you change the tail per metric in experiment setup, shows a one-sided interval that extends to infinity on the untested side, and warns that running two one-sided tests gives a less powerful test with intervals that look tighter than warranted. Convert, in a post updated on August 27, 2026, also lets you pick a left or right tail. Georgiev’s article listed several vendors as two-tailed, based on a ConversionXL roundup from July 2015; more than ten years and several engine changes later, that list is not used here as a current snapshot. This blog’s calculators: the significance one runs a two-sided z-test; the sample size one has a two-sided and one-sided selector.
Worked example: ecommerce and SaaS with the calculators
Ecommerce: planning with the sample size calculator
Scenario. A store with a 3.00 percent product page conversion rate and 42,000 visitors a week (6,000 a day) wants to test a social proof block above the buy button. The decision is binary: ship the block if it lifts conversion; do not ship if it does not. A worse result would lead to the same decision as a tie, and the team records in the plan, before starting, one-tailed test, direction variation better, 95 percent confidence, 80 percent power, 10 percent relative minimum effect.
In the calculator below, enter: Current conversion rate 3; Minimum detectable effect 10, with relative (%) selected; Confidence 95; Power 80; Visitors per week (total) 42000; Test two-sided.
Two-proportion normal approximation, 2 variations (50/50). Tweak the inputs and watch it update live.
The screen shows 53,211 visitors per variation, 106,422 in total and 18 as the estimated duration, in days. Now switch only the Test field to one-sided: the screen changes to 41,914 per variation, 83,828 in total and 14 days. Rounded to full weeks, that is three weeks versus two. For the SaaS scenario below, the same steps with rate 8, effect 15 and 6000 visitors a week show 8,568, 17,136 and 20 days two-sided, and 6,749, 13,498 and 16 days one-sided.
Ecommerce: the result and the significance calculator
After 14 days, with 42,000 visitors per arm (above the 41,914 planned):
| arm | visitors | conversions | rate |
|---|---|---|---|
| A, control | 42,000 | 1,260 | 3.00% |
| B, with social proof | 42,000 | 1,350 | 3.21% |
Paste into the calculator: Control (A) with 42000 visitors and 1260 conversions; Variation (B) with 42000 visitors and 1350 conversions; Confidence 95%.
Two-sided two-proportion z-test. "Not significant" almost always means not enough sample, not that the versions are equal.
The screen shows a 3.00% control rate and 3.21% variation rate, relative lift of +7.1%, p-value of 0.0735, 95 percent interval for the difference of -0.0% … +0.4% (pp) and the verdict Not significant yet. That verdict is the two-tailed one, because two-tailed is the only test the calculator runs.
The math underneath, at full precision:
- Pooled rate: (1,260 + 1,350) ÷ 84,000 = 3.1071%.
- Standard error of the difference under the null: √[0.031071 · 0.968929 · (1÷42,000 + 1÷42,000)] ≈ 0.001197.
- Difference: 3.2143% − 3.0000% = +0.2143 percentage points.
- z-score: 0.002143 ÷ 0.001197 ≈ 1.7897.
- Two-tailed p-value: 0.073505. The 95 percent interval runs from minus 0.0204 to plus 0.4490 percentage points; the “-0.0%” on screen is that minus 0.0204 rounded to one decimal.
Now the recorded one-tailed reading. The effect went the predicted way (B ahead), so the one-tailed p-value is the two-tailed one halved: 0.073505 ÷ 2 = 0.036752, below 0.05. Under the recorded plan, B wins. The one-sided 95 percent lower bound for the difference, which is the lower bound of the two-sided 90 percent interval, sits at plus 0.0173 percentage points: above zero, barely.
The calculator has a shortcut. Switch Confidence to 90%: the p-value stays at 0.0735, the interval becomes +0.0% … +0.4% (pp) and the verdict turns into Significant winner · B wins. That happens because two-tailed at 90 percent uses the same cutoff as one-tailed at 95 percent, 1.645, and on the variation side both decisions coincide. Two caveats: the interval shown is the two-sided 90 percent one (the field label still reads “95% CI of the difference”, but the bounds are already the 90 percent ones), and at 90 percent the calculator would also call A wins if z fell below minus 1.645, a conclusion the recorded one-tailed test does not have.
SaaS: when the tail saves no calendar time and flips the verdict
Scenario. A B2B SaaS with 6,000 weekly visitors on its pricing page, 8.00 percent of whom start a trial, tests a plan table with the middle plan highlighted. Minimum effect of 15 percent relative. As the weeks figure showed, two-tailed needs 20 days and one-tailed 16, and both round up to three weeks. The team runs 21 days and reaches 9,000 visitors per arm.
| arm | visitors | trials | rate |
|---|---|---|---|
| A, current table | 9,000 | 720 | 8.00% |
| B, middle plan highlighted | 9,000 | 785 | 8.72% |
In the same significance calculator, with 9000 and 720 for control, 9000 and 785 for the variation and 95% confidence, the screen shows 8.00% and 8.72%, relative lift of +9.0%, p-value of 0.0801, interval of -0.1% … +1.5% (pp) and Not significant yet. At full precision: a difference of plus 0.7222 percentage points, z of 1.7503, two-tailed p-value of 0.080072 and an interval from minus 0.0865 to plus 1.5309 percentage points.
Had the team recorded one-tailed upfront, the p-value would be 0.080072 ÷ 2 = 0.040036 and B would win, with a one-sided lower bound of plus 0.0436 percentage points. If the team had recorded two-tailed, the result is “not significant”, and switching to one-tailed now is exactly the simulation rescue: the variation false win rate goes from about 2.5 to about 5 percent, with nobody writing that down in the report.
The tail did not save a single test day; it only flipped the verdict on a result that landed between 1.645 and 1.96. That is how one-tailed tests tend to show up in real life: after the result, not in planning. If the plan was two-tailed, the honest reading is inconclusive with a positive signal: the interval runs from a small loss to a 1.5 point gain, and the decision is to extend to the sample for the effect you care about or rerun with the direction recorded, without falling for observed power.
Checklist: one-tailed vs two-tailed test
Answer before you configure the experiment, and keep the answers with the plan.
| question | if yes | if no |
|---|---|---|
| Is the direction of interest written down before any data? | one-tailed is possible | two-tailed |
| Would a worse result lead to the same decision as a tie? | one-tailed is possible | two-tailed |
| Is “the idea made things worse” a learning worth having? | prefer two-tailed | one-tailed is possible |
| Are both versions new, with either able to ship? | two-tailed | keep going |
| Is the metric a guardrail or a non-inferiority check? | one-tailed in the regression direction | keep going |
| Will the report say “one-tailed” next to the confidence level? | one-tailed is possible | two-tailed |
| Does the sample saving change the number of test weeks? | the saving is real | the tail buys no calendar time |
| Is finishing sooner the only reason for one-tailed? | reconsider: that is loosening the bar | keep going |
If every row points to “one-tailed is possible”, record the direction and go. If any row points to two-tailed, use two-tailed. When in doubt, two-tailed: it errs on the conservative side, and the cost is about 21 percent more sample, not a wrong conclusion.
Common mistakes
- Halving the p-value after seeing it missed. That is the simulation rescue. If the plan was two-tailed, the p-value is the two-tailed one.
- Halving when the variation is behind. The one-tailed p-value there is 1 minus half the two-tailed one: 0.9632 in the reversed ecommerce example, not 0.0368.
- Calling one-tailed at 95 percent “95 percent confidence” without qualification. Readers assume two-tailed. The same bar, stated two-tailed, is 90 percent.
- Using one-tailed to save sample on a low-traffic SaaS test and forgetting about weeks. In the example, the saving was zero calendar days. For low traffic, our guide on CRO for low-traffic sites lists bigger levers.
- Running one-tailed and ignoring the drop. The test cannot declare a regression, but the numbers are right there. Look at the two-sided interval anyway, or keep a one-tailed guardrail in the regression direction.
- Running two one-tailed tests, one each way, and keeping whichever worked. That is a two-tailed test with double the alpha, and Statsig warns it produces intervals that look tighter than warranted.
- Assuming Bayesian stats solve the tail question. The probability that B beats A is directional by construction, and stopping when it crosses 95 percent on a random day is plain peeking. Our Bayesian A/B testing guide shows how to set the rule upfront.
Automate this with Donnu
The specific pain in this guide is not one-tailed math, which fits on one line. It is the choice made after looking at the data, unnoticed, by a team that wanted to see the variation win.
Donnu A/B reports are Bayesian: instead of a p-value and a tail selector, they show the probability that the variation beats the control day by day, with a 95 percent band on the chart and guidance that the decision has matured only when the line crosses the band and stays there. A low probability shows on the same chart as a high one, so a regression does not disappear. There is no tail setting to flip after seeing the result, and the report requires a minimum number of visitors per variation and days of testing before it declares a winner. That does not replace a plan: the primary metric and the effect you care about are still your calls, made upfront.
If you run frequentist tests in another tool, the free calculators do the math in this guide: sample size with a two-sided and one-sided selector, two-sided significance, p-value and the peeking simulator. For a report that never asks you to pick a tail, start a 14-day free trial.
References
- Georgiev, G. One-tailed vs Two-tailed Tests of Significance in A/B Testing. Analytics-Toolkit.com blog, published in 2017 and last updated August 8, 2018. Source for the case for one-tailed tests when action depends on a significant difference in one direction, the estimate that a two-sided test at 95 percent needs 20 to 60 percent more sample than a one-sided one, and the claim that one-tailed tests do not allow more type I errors. Page read. blog.analytics-toolkit.com.
- Georgiev, G. 12 myths about one-tailed vs. two-tailed tests of significance. OneSided.org. Source for the position that one-sided p-values and confidence bounds carry the same error probabilities as two-sided ones under their respective nulls, and that a directional claim can be supported by a one-sided test without a prior prediction. Page read. onesided.org.
- ICH. E9: Statistical Principles for Clinical Trials. International Council for Harmonisation, 1998. Source for the requirement to justify one-sided tests prospectively, the acknowledgment that the topic is controversial, the regulatory preference for a one-sided type I error at half the two-sided one, and the use of one-sided intervals for non-inferiority. PDF read with text extraction. database.ich.org.
- GraphPad. P values. One-tail or two-tail? (FAQ 1318). Source for the halving relationship in the predicted direction, the rule to predict the direction before collecting data, the consequence of attributing an opposite-direction difference to chance, and the recommendation to use only two-tailed p-values. Page read. graphpad.com.
- UCLA Statistical Methods and Data Analytics. FAQ: What are the differences between one-tailed and two-tailed tests? Source for how alpha is split between tails, the consequences-based criterion for one-tailed tests, and the rule against choosing one-tailed to reach significance or after a failed two-tailed test. Page read. stats.oarc.ucla.edu.
- Optimizely. Statistical significance. Help center, checked on September 15, 2026. Source for Optimizely using two-tailed tests because they are required for Stats Engine false discovery rate control, and for its definitions of two-tailed and one-tailed tests. support.optimizely.com.
- Statsig. One-Sided Test. Documentation, checked on September 15, 2026. Source for the two-sided default, the one-sided use cases for guardrail regressions and changes that matter in one direction only, the crash rate example, allocating all of alpha to the direction of interest, one-sided intervals extending to infinity, and the warnings about the unspecified direction and running two one-sided tests. docs.statsig.com.
- Convert. The Next Generation of Convert Experiences. Convert blog, updated August 27, 2026, checked on September 15, 2026. Source for frequentist mode offering one-tailed, two-tailed and sequential tests, Bonferroni and Sidak corrections, and a left-tailed or right-tailed choice. convert.com.
Read next: A/B testing statistical significance · The peeking problem · Minimum detectable effect · Equivalence testing · Pre-registered analysis plan · How many visitors an A/B test needs · Statistical power calculator · Leia em português
Frequently asked questions
- What is the difference between a one-tailed and a two-tailed test?
- A two-tailed test looks for a difference in either direction and splits the false positive risk across both tails: at 95 percent confidence, 2.5 percent on each side, with a critical z of 1.96. A one-tailed test looks for a difference in a single direction chosen before the test and puts the whole 5 percent there, with a critical z of 1.645. It needs less evidence to call an improvement and has no way to call a regression.
- Is the one-tailed p-value always half the two-tailed p-value?
- Only when the observed effect goes in the predicted direction. Then the one-tailed p-value is exactly half the two-tailed one: in this guide, 0.0735 becomes 0.0368. If the effect goes the other way, the one-tailed p-value is 1 minus half the two-tailed value, 0.9632 in the same example, and the result is not significant no matter how bad the drop is.
- How much sample does a one-tailed test save?
- At 95 percent confidence and 80 percent power, about 21 percent of visitors at any baseline: 41,914 versus 53,211 per variation to detect a 10 percent relative lift on a 3 percent conversion rate. At 90 percent power the saving shrinks to about 18.5 percent. When a test has to run whole weeks, part of that saving disappears in the rounding.
- Is picking the tail after seeing the result cheating?
- It is the use that inflates error. In this guide simulation, with 20,000 A/A tests and a fixed seed, testing one-tailed in whichever direction the data went produced a significant difference in 9.89 percent of tests, against 5.00 percent for a two-tailed test. And a team that runs two-tailed and switches to one-tailed only when the variation is ahead doubles the variation false win rate, from 2.57 to 5.12 percent.
- When is a one-tailed test legitimate in A/B testing?
- When the direction was recorded before the test and a worse result would lead to the same decision as a tie, such as not shipping the variation. It is also the natural form of guardrail metrics and non-inferiority tests, where only a regression matters. Outside those cases, two-tailed is the safer default, and it is what Optimizely uses and what Statsig ships as its default setting.
- Does the significance calculator in this guide run a one-tailed test?
- No. It runs a two-sided two-proportion z-test. To get the one-tailed p-value, halve the value on screen when the variation is ahead in the direction you recorded beforehand. Selecting 90 percent confidence reproduces the decision of a one-tailed test at 95 percent on the variation side, but the interval on screen becomes the two-sided 90 percent one, even though the field label still says 95 percent.